



- Office for HealthImprovement & Disparities
Introduction
The Office of Health Improvement and Disparities (OHID
), part of the Department of Health and Social Care (DHSC
), in collaboration with NHS England, has developed local modelled prevalence estimates for severe mental illness (SMI
) in England. Prevalence estimates for the SMI
condition groups (schizophrenia, bipolar disorder and other psychosis) are also included. It is the first time that local level estimates have been produced for the SMI
condition groups.
These prevalence estimates have been derived using people aged 14 and over identified as having an SMI
on 30 September 2023 (the index date). These cases were identified in the Clinical Practice Research Datalink (CPRD
) Aurum database, which holds anonymised record level primary care data
Due to data availability and time for analysis, estimates have been produced for 2023, and these are presented in this report
All local level prevalence figures are available in the Adult mental health and wellbeing profile on Fingertips
The purpose of this report and associated data tables is to:
- present modelled estimates for SMI
and condition groups (schizophrenia, bipolar disorder and other psychosis) for England - present analysis of modelled estimates for SMI
and the condition groups by administrative geographies in England - describe how the SMI
and condition group prevalence estimates were derived, detailing the factors (sex, age, ethnicity and deprivation) that were included to model local area estimates - provide guidance on how to use these estimates to understand need in the population, particularly at a local level
- compare these new prevalence estimates to other current relevant publications to understand the differences and show the value of each
The indicators in the Adult mental health and wellbeing profile on Fingertips and this report are for:
- national organisations that lead and develop strategy, policy and guidance for care and support of people with SMI
- local organisations that plan and deliver services for people with SMI
, including NHS and non-NHS providers of care
Strategic direction
As part of the 10 Year Health Plan for England, the government has committed to a new approach to mental health
To understand the size and breadth of mental health need, in 2025 the government launched an independent review into prevalence and support for mental health conditions, ADHD and autism. From 2026 to 2027 the government is making available capital funding of £473 million over 4 years to invest in new models, including community-based mental health centres, mental health emergency departments and eliminating out-of-area placements. This capital investment sits within a total of around £5 billion being provided over 4 years to deliver more care in communities and meet the performance improvement targets government set through the NHS medium term planning framework. The government is also continuing to expand individual placement and support (IPS) for individuals with SMI
.
Alongside this investment, the government will publish a new modern service framework (MSF
) for SMI
, which will set consistency in clinical standards across the country so that patients and families get the best quality, evidence-based treatment and support
Summary of findings
For people aged 14 and over in England in 2023 the modelled prevalence of SMI
is 1.16%, which breaks down into:
- schizophrenia – 0.38%
- bipolar disorder – 0.42%
- other psychosis – 0.36%
From the modelled prevalence estimates for sub national geographies, findings include that:
- regionally there is higher prevalence of SMI
in the north of England (both North East and North West) and at upper tier local authority (UTLA
) level there is higher prevalence in urban and more deprived areas - schizophrenia and other psychosis are more common in deprived and urban areas, whereas bipolar disorder is more evenly distributed across England
- the breakdown of SMI
in London (region) into the condition groups is different to other regions. It has the highest prevalence of schizophrenia and lowest prevalence of bipolar disorder
From analysis of the approximately 150,000 SMI
cases identified in CPRD
(but not modelled), findings include that:
- SMI
, schizophrenia and other psychosis have higher prevalence in males while bipolar disorder is more prevalent in females - SMI
and the 3 condition groups have the highest prevalence in the 45 to 64 age group and lowest prevalence in the 14 to 24 age group - SMI
, schizophrenia and other psychosis have the highest prevalence in the Black ethnic group while bipolar disorder has the highest prevalence in the White ethnic group
These new prevalence estimates add to and complement existing intelligence on SMI
, psychosis and bipolar disorder, including the Adult Psychiatric Morbidity Survey (APMS
) and the Quality and Outcomes Framework (QOF
)
About these modelled estimates
To improve understanding of this report, some important terms and aspects of the work are explained. For further detail on how these terms are defined and used, and on how results were generated, see the more detailed methodology section of the report
SMI
explained
This report presents prevalence estimates for 3 mental health condition groups – schizophrenia, bipolar disorder and other psychosis, both separately and combined as SMI
. It does so with the aim of enabling effective planning for people who experience these conditions
The needs of people with these 3 conditions are important but it should be recognised that they are generally planned for within a wider group which can be described as people with severe and enduring mental health problems. This group is also referred to as adults and older adults whose lives are severely impacted by mental health problems
Why SMI
is important
The group of conditions referred to as SMI
relates to people with psychological problems that are often so debilitating that their ability to engage in functional and occupational activities is severely impaired
People with SMI
experience some of the widest health inequalities in England. NHS England’s guidance for integrated care systems highlights that their life expectancy is 15 to 20 years shorter than that of the general population, and that the gap is widening
To ensure that both the mental and wider health needs of people living with SMI
are adequately supported, data on the local prevalence of SMI
(including breakdown of individual condition groups) is essential. This data on local prevalence enables planning, commissioning and delivering services that meet local needs of people across England
Prevalence
This report uses the term ‘prevalence’; however, it should be acknowledged that this analysis effectively estimates ‘treated prevalence’ rather than true population prevalence. This is because SMI
cases in this analysis are identified through contact with the health care system. It should also be acknowledged that cases are identified from people registered with a general practice. Although this is a reasonable representation of the overall population, it is not the same. Levels of registration may vary by sociodemographic factors that also affect SMI
risk, which may in turn lead to some underestimation of prevalence.
Prevalence needs a timeframe. It can be defined as either point, period or lifetime. Although this study uses a point in time approach (the index date, 30 September 2023) it estimates lifetime prevalence. This is because recorded evidence of SMI
is looked for at any time in the individual’s medical records history up to the index date
Modelled estimates
These prevalence proportions are modelled estimates. They are not based on direct counts of people with SMI
in each local area. They are based on patterns seen in a large sample of the population in England. Factors such as age, sex, ethnicity and deprivation are included because they are associated with SMI
and can be measured consistently across all areas. However, these are not the only factors that influence how prevalent SMI
is, so the approach can be improved and the modelled estimates refined.
Approach used to develop the prevalence estimates
Prevalence estimates are derived from an analysis of primary care records from the CPRD
database, which includes records for around 25% of England’s population. Around 150,000 people aged 14 years and over were identified as cases up to 30 September 2023 (the index date) based on evidence of a record for:
- diagnosis of schizophrenia, bipolar disorder or other psychosis
- lithium treatment for bipolar disorder in the last 6 months
- other treatment (excluding pharmacological) for SMI
in the last 6 months - significant symptoms of SMI
in the last 12 months
In this analysis the condition groups are mutually exclusive, meaning estimates are derived on the basis that each individual with SMI
will be recorded in one condition group only
SMI
(and condition group) prevalence estimates were modelled using multivariable logistic regression (a statistical method that determines how multiple variables simultaneously influence the likelihood of a health event or outcome). The method was used to derive prevalence for the CPRD
cases disaggregated into 200 strata. This means prevalence estimates for all combinations of the following groups:
- sex (female or male)
- age (14 to 24 years, 25 to 34 years, 35 to 64 years, and 65 years and over)
- broad ethnic group (Asian, Black, Mixed, Other and White)
- area deprivation (quintiles from 1 (most deprived) to 5 (least deprived))
The prevalence percentage for each of these strata were then applied to the same strata in the England, regional, integrated care board (ICB
) and UTLA
populations. These 200 strata were then aggregated to provide model estimates of number of cases and prevalence percentage for each area
Credible intervals (CrIs
)
The local prevalence proportions would usually be accompanied by Crls produced (using simulation) to take account of the uncertainty around the derived estimates. They are not presented in this report because the very large underlying population would result in intervals that are extremely narrow, implying a degree of precision that is not warranted given the model is applied to local (UTLA
and ICB
) populations. The absence of CrIs
should not be taken to indicate the estimates are exact.
Main findings and interpretation
This section of the report presents the England level modelled prevalence estimates for SMI
and the condition groups. It also presents the geographical variation seen across England and describes some of the patterns in prevalence that can be seen
Modelled prevalence for SMI
(and condition groups) in England
Table 1: estimates of SMI
(and condition group) prevalence in England, 2023
| Condition group | Estimated prevalence % England | Estimated number of people 14 and over affected |
|---|---|---|
| SMI | 1.16 | 551,259 |
| Schizophrenia | 0.38 | 177,979 |
| Bipolar disorder | 0.42 | 200,542 |
| Other psychosis | 0.36 | 172,259 |
Data S
) population data
Note: as each condition group is modelled separately their sum may not equal the SMI
figure in table 1
Table 1 provides the England level prevalence of the SMI
and condition groups. Although the contribution of each condition group to overall SMI
is similar, there are estimated to be more cases of bipolar disorder, followed by schizophrenia and then other psychosis
Modelled prevalence for SMI
(and condition groups) by geography
Tables 2 and 3 show prevalence of SMI
and condition groups modelled at 4 sub-national geographies including:
- 153 UTLAs
- 42 ICBs
- 9 statistical regions
- 7 NHS regions
Note: for purposes of presentation there are 151 UTLAs
. This is because the following UTLAs
have been combined:
- City of London and Hackney
- Cornwall and the Isles of Scilly
Table 2: range of estimates for SMI
(and condition group) prevalence (%) in England by geography, 2023
| Geographical breakdown | SMI | Schizophrenia | Bipolar disorder | Other psychosis |
|---|---|---|---|---|
| UTLA | 0.82% to 1.58% | 0.21% to 0.62% | 0.29% to 0.53% | 0.25% to 0.52% |
| ICB | 0.92% to 1.37% | 0.25% to 0.49% | 0.34% to 0.48% | 0.28% to 0.44% |
| Statistical region | 1.04% to 1.30% | 0.31% to 0.43% | 0.37% to 0.47% | 0.32% to 0.40% |
| NHS region | 1.04% to 1.27% | 0.31% to 0.43% | 0.37% to 0.45% | 0.32% to 0.40% |
Table 2 shows that there are differences in prevalence by geography for SMI
and all condition groups, however the size of these differences vary. The greatest geographical variation is seen at UTLA
level, where the population size and structure vary most. For the condition groups, schizophrenia shows the widest prevalence range (0.21% to 0.62%, a 3-fold variation), whereas bipolar disorder has the narrowest (0.29% to 0.53%, a less than 2-fold variation).
Table 3: range of estimates for SMI
(and condition group) count in England by geography, 2023
| Geographical breakdown | SMI | Schizophrenia | Bipolar disorder | Other psychosis |
|---|---|---|---|---|
| UTLA | 318 to 15,106 | 84 to 4,855 | 140 to 5,789 | 94 to 4608 |
| ICB | 5,040 to 32,412 | 1,575 to 10,417 | 1,950 to 11,908 | 1,517 to 10,014 |
| Statistical region | 29,055 to 87,101 | 9,363 to 31,224 | 10,614 to 32,146 | 9,008 to 28,628 |
| NHS region | 54,378 to 107,074 | 16,596 to 35,015 | 21,396 to 38,548 | 16,429 to 33,504 |
Data source: OHID
, based on CPRD
and ONS
population data.
Table 3 shows how the estimated number of people with SMI
(and condition groups) varies widely across areas. This reflects differences in both the prevalence of the condition and the size and structure of local populations
Numbers of cases and prevalence proportions
While prevalence proportions and numbers of cases are both important, they describe different things and should be considered separately. Areas may have similar prevalence proportions but very different numbers of people affected, and an area with a low prevalence proportion may still have a large number of cases if it has a large population
Note: it is important to recognise that the highest and lowest figures in each range in table 3 may not match the highest and lowest area in table 2
Presentation by UTLA
Figure 1: map of model-based SMI
prevalence in England by UTLA
, 2023

Data ure 1 can be found in table 1 of the accompanying data tables in the Adult mental health and wellbeing profile: April 2026 update
Figure 1 shows higher prevalence of SMI
in:
- urban areas including UTLAs
in north east, east, central and south east London, and around Birmingham, Leeds and Manchester - more deprived coastal areas including Blackpool, Hull, around Liverpool, Middlesborough and Newcastle
Figure 2: map of model-based schizophrenia prevalence in England by UTLA
, 2023

Data ure 2 can be found in table 2 of the accompanying data tables in the Adult mental health and wellbeing profile: April 2026 update
Figure 2 (when compared to figures 3 and 4) shows that schizophrenia has the widest range in estimated prevalence at UTLA
level of the 3 condition groups. It also shows higher prevalence of schizophrenia in more deprived urban areas including north east, east, central and south east London, Blackpool, Birmingham, Hull, Liverpool, parts of greater Manchester, Newcastle, Nottingham and Stoke-on-Trent.
Figure 3: map of model-based bipolar disorder prevalence in England by UTLA
, 2023

Data ure 3 can be found in table 3 of the accompanying data tables in the Adult mental health and wellbeing profile: April 2026 update
Figure 3 shows bipolar disorder has the narrowest range in values (least variation) of the 3 condition groups at UTLA
level. It also shows higher prevalence in:
- urban and rural north and north east England
- urban areas around Liverpool and Leeds
- some rural areas (Cornwall, Herefordshire and Isle of Wight)
Figure 4: map of model-based in other psychosis prevalence in England by UTLA
, 2023

Data ure 4 can be found in table 4 of the accompanying data tables in the Adult mental health and wellbeing profile: April 2026 update
Figure 4 shows other psychosis has a similar pattern of higher prevalence to the SMI
map, with some additional higher prevalence in:
- some Midlands urban areas (Nottingham and Stoke-on-Trent)
- cities in the south of England (including Bristol, Plymouth, Portsmouth and Southampton)
Presentation by ICB
Figure 5: map of model-based SMI
prevalence in England by ICB
, 2023

Data ure 5 can be found in table 5 of the accompanying data tables of the Adult mental health and wellbeing profile: April 2026 update
Figure 5 shows a similar picture to the UTLA
map, but with less variation between areas. The pattern of higher prevalence in urban areas is less obvious, due to larger more mixed ICB
populations. The highest prevalence is in ICBs
:
- in the north of England
- around Birmingham, Liverpool and Manchester
- in east and north east London
- in Cornwall
Presentation by statistical region
Figure 6: model-based estimates of SMI
(and condition group) prevalence (%) in England by statistical regions, 2023

Data ure 6 can be found in table 6 of the accompanying data tables of the Adult mental health and wellbeing profile: April 2026 update
Figure 6 shows the estimated prevalence for SMI
and condition groups by statistical region
For SMI
there is a clear north to south decrease in prevalence ranging from the North East (1.30%) to the South East (1.04%). London (1.19%) does not quite fit this pattern
For the schizophrenia condition group, London (0.43%) has the highest prevalence. After London, there is the similar decrease to that seen for SMI
, from the North East (0.42%) to the South East (0.31%)
Bipolar disorder has a similar pattern to SMI
, ranging from the highest prevalence in the North East (0.47%) down to the South East (0.41%). London (0.37%) has the lowest prevalence and is the only region where bipolar disorder prevalence is lower than the other 2 condition groups
The pattern of prevalence for other psychosis (the North East (0.40%) to the South East (0.32%)) is similar to SMI
. The exception again is London (0.39%) where the prevalence proportion is one of the highest, just below the North East and the North West
It is worth noting that the breakdown of SMI
between the 3 condition groups in London is different to all other regions. It is the only region where bipolar disorder does not have the highest prevalence and in fact has the lowest. It is also the only region where schizophrenia has the highest prevalence
Note: a figure for NHS regions is not presented in this section due to the geography being similar in size to statistical region. This data can be accessed from the Adult mental health and wellbeing profile on Fingertips
Variation in prevalence by sex, age, ethnicity and deprivation
The local area modelled estimates of SMI
and condition groups are derived from assessing the interrelating variation in the prevalence of conditions by sex, age, ethnic group and deprivation. In this section each of those factors is assessed separately. The data from CPRD
is presented to examine the association of sex, age, ethnicity and deprivation with SMI
(and condition group) prevalence within the cases identified.
Note: the prevalence figures presented in this section are derived from the CPRD
2023 cases only. They are not modelled prevalence estimates
Sex
Figure 7: SMI
(and condition group) prevalence (%) in CPRD
by sex, 2023

Data le 7 of the accompanying data tables in the Adult mental health and wellbeing profile: April 2026 update
Figure 7 shows the SMI
(and condition group) prevalence varies between males and females. SMI
prevalence is higher in males (1.25%) than females (1.12%). For other psychosis the difference is larger (males 0.42%, females 0.33%) and for schizophrenia the prevalence is almost double in males (0.51%) than in females (0.28%). The opposite is the case for bipolar disorder where prevalence in females (0.50%) is higher than males (0.32%).
Age
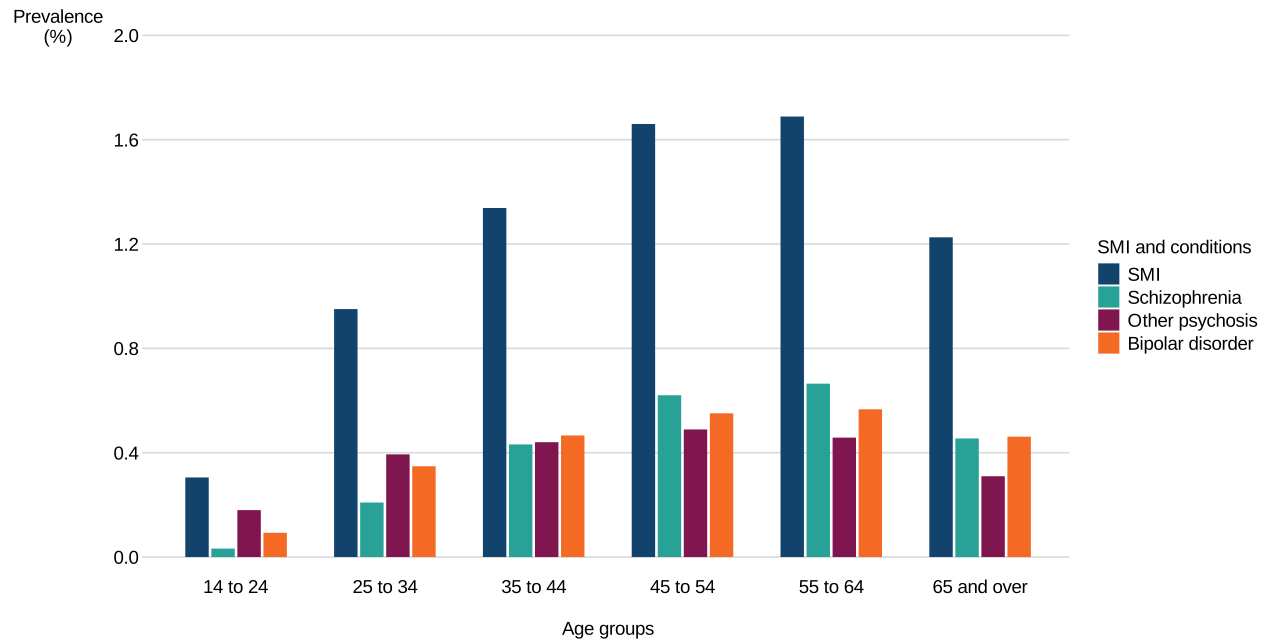
Figure 8: SMI
(and condition group) prevalence (%) in CPRD
by age group, 2023
Data le 8 of the accompanying data tables of the Adult mental health and wellbeing profile: April 2026 update
Figure 8 shows that SMI
(and condition group) prevalence varies by age. Prevalence proportions are presented for 6 age groups. This is a more detailed breakdown than is used within the modelling. It is worth remembering that age is based on date of investigation (index date) rather than age at diagnosis
For SMI
, prevalence proportions are lowest in the youngest age group (14 to 24, 0.31%). They increase with age through to middle age (55 to 64, 1.69%) and then reduce in the oldest age group (65 and over, 1.23%)
All 3 condition groups show similar trends, although the increase to 55 to 64 is greatest for schizophrenia. The other psychosis condition group has the highest prevalence for ages 14 to 24 (0.18%) and 25 to 34 (0.39%). Prevalence proportions are similar across all 3 condition groups in the 35 to 44 age group (schizophrenia 0.43%, bipolar disorder 0.47% and other psychosis 0.44%). Prevalence of schizophrenia is highest in the 45 to 54 (0.62%) and 55 to 64 (0.66%) age groups, and the prevalence for bipolar disorder is highest in the 65 and over age group (0.46%).
Ethnicity
Figure 9: SMI
(and condition group) prevalence (%) in CPRD
by ethnic group, 2023

Data le 9 of the accompanying data tables in the Adult mental health and wellbeing profile: April 2026 update
Figure 9 shows that SMI
(and condition group) prevalence varies by ethnic group. For SMI
, prevalence proportions are highest in the Black ethnic group (1.95%), which is more than double the prevalence in the Asian (0.82%) and Other (0.84%) ethnic groups
The highest prevalence of schizophrenia is seen in the Black ethnic group (0.98%), followed by the Mixed (0.60%) ethnic group. The highest prevalence of other psychosis is also seen in the Black ethnic group (0.70%), followed by the Mixed ethnic group (0.54%). Bipolar disorder prevalence is highest in the White (0.46%) ethnic group, followed by the Mixed ethnic group (0.40%)
The difference between condition groups is greater in the Black ethnic group than any other ethnic group. The prevalence of schizophrenia (0.98%) is more than 3 times higher than bipolar disorder (0.27%), and other psychosis (0.70%) is more than 2 times bipolar disorder
The prevalence of schizophrenia in the Black ethnic group (0.98%) is around 3 times the prevalence seen in the White (0.36%), Asian (0.34%) and Other (0.28%) ethnic groups. The prevalence of bipolar disorder in the White ethnic group (0.46%) is around 2 times the prevalence seen in the Black (0.27%), Other (0.23%) and Asian (0.19%) ethnic groups
The Asian and Other ethnic groups tend to have the lowest prevalence proportions across SMI
and all 3 condition groups
Note: 3.68% of the overall CPRD
cases did not have a record of ethnicity and were therefore excluded from this study
Area deprivation
Figure 10: SMI
condition prevalence (%) in CPRD
by area deprivation decile, 2023

Data ble 10 of the accompanying data tables in the Adult mental health and wellbeing profile: April 2026 update
Figure 10 shows that SMI
(and condition group) prevalence varies by area deprivation. Deprivation in this report is measured by the index of multiple deprivation (IMD
) 2019 and is presented by decile (rather than quintile, which is used for the modelling)
For SMI
there is a clear decrease from the most deprived decile (1.85%) to the least deprived (0.73%). This trend is repeated for schizophrenia (0.70% in the most deprived to 0.16% in the least deprived) and other psychosis (0.63% in the most deprived to 0.22% in the least deprived). A similar trend can be seen for bipolar disorder (0.52% in the most deprived to 0.35% in the least deprived), although the difference between most deprived and least deprived is smaller and the relationship with deprivation less clear.
In the most deprived areas (deciles 1, 2 and 3) schizophrenia is the most prevalent condition group, followed by other psychosis. In decile 4, all 3 condition groups are similarly prevalent. From deciles 5 to 10 bipolar disorder is the most prevalent condition group, and by decile 10 (least deprived) bipolar disorder (0.35%) is more than twice as common as schizophrenia (0.16%)
Comparison to other intelligence on SMI
or condition group prevalence
Although the intelligence included within this report gives new insight on geographical variation and the differences seen between condition groups, it is not the only up to date source of prevalence data relating to SMI
for England. This section provides summary intelligence from 2 other sources (APMS
2023 to 2024 and QOF
2023 to 2024) and where possible compares prevalence between these sources and the modelled estimates.
The NHS England APMS
2023 to 2024 report does not include an estimate of SMI
in the England population. There would be limited value in combining estimates for psychotic disorder and bipolar disorder as one is a screened positive population while the other is from a 2-phase approach including clinical examination. Therefore, a comparison to SMI
is not made and the condition groups are considered separately.
Psychotic disorder
The APMS
2023 to 2024 includes a chapter on adults with psychotic disorder in the last year. Those with a disorder were identified using a 2-phase approach consisting of screening followed by a clinical examination using the schedules for clinical assessment in neuropsychiatry (SCAN)
Prevalence of psychotic disorder in the past year was 0.4% (95% confidence interval (CI
) 0.2, 0.7) in 2023 to 2024. This rate was similar to 0.7% (CI
0.4, 1.1) in 2014 and 0.4% (CI
0.3, 0.6) in 2007. These figures indicate broad stability across the period covered by the surveys
Because psychotic disorders have a low prevalence, data from 2007, 2014 and 2023 to 2024 were combined to increase the number of positive cases for further analysis. However, conclusions about trends should be treated with caution considering the numbers of confirmed cases were low (23 adults in 2007, 26 in 2014 and 16 in 2023 to 2024)
Psychotic disorder was associated with area and economic deprivation. Adults living in the most deprived quintile were more likely to be identified with psychotic disorder (1.0%) than adults living in the least deprived quintile (close to 0.0%). Adults with problem debt (1.7%) were more likely to have a psychotic disorder than those without problem debt (0.4%)
Comparison between APMS
2023 to 2024 and CPRD
based analysis – psychosis
For purposes of this report the APMS
2023 to 2024 survey results are compared to the modelled estimates for the schizophrenia (0.38%) and other psychosis (0.36%) condition groups. Although not measured in the same way, these estimates are broadly comparable and the variation by deprivation is also broadly consistent. It should be noted that the APMS
surveys identify individuals with a psychotic disorder in the last year who did not know they had a disorder. The identification of people in this way is less likely in the CPRD
based analysis. The CPRD
analysis includes a larger number of cases, which allows a more robust assessment of variation across a range of factors.
Bipolar disorder
APMS
2023 to 2024 includes a chapter on adults who screen positive for bipolar disorder. The term ‘screening’ refers to identifying people with a higher likelihood of having a disorder. A definitive diagnosis of bipolar disorder would require a comprehensive clinical assessment, which was not carried out in the survey
The prevalence of adults who screened positive for bipolar disorder was 1.9% (CIs
1.5% and 2.4%), which was similar to 2014 (2.0%). Prevalence of screening positive for bipolar disorder was similar for men and women, and generally higher in younger age groups (especially those aged 25 to 44) than older. People screening positive for bipolar disorder often face socioeconomic adversity. It was more likely among those seriously behind with debt repayments (6.4%) and in people of working age who were unemployed (9.0%) or economically inactive (4.9%). It was also more likely in those living in a more deprived local area (3.6%).
The proportion of adults screening positive for bipolar disorder did not vary significantly by region. It did vary by ethnic group, with lower prevalence proportions in the White Other (0.3%, 95% CI
0.1, 1.2), Black or Black British (0.7%, CI
0.2, 2.1) and Asian or Asian British (0.7%, CI
0.2, 2.3) groups, and higher prevalence among the Mixed, Multiple and Other groups (5.1%, CI
1.1, 20.7). 2.4% of those in the White British group screened positive (CI
1.8, 3.0). It should be noted that the CIs
for some estimates were wide and overlapping, so apparent differences between ethnic groups should be treated with caution.
Comparison between APMS
2023 to 2024 and CPRD
based analysis – bipolar disorder
Comparison between APMS
2023 to 2024 and the CPRD
based analysis is complex as there are differences in the methodologies. Although both assessments look across the lifespan, the predominantly diagnosis-based prevalence from CPRD
is 0.42% of those aged 14 and over, whereas APMS
2023 to 2024 estimates that 1.9% of adults screen positive for bipolar disorder – a population approximately 5 times larger. However, APMS
2023 to 2024 also reports that one in 6 (17.8%) adults who screened positive reported that they had been diagnosed with bipolar disorder by a professional. It should also be recognised that a contributing factor to lower case identification in primary care data is time taken for diagnosis – some research suggests there can be as much as 5 to 10 years between onset of symptoms and arrival at confirmed bipolar disorder diagnosis [footnote 1].
The variation in prevalence proportions within these 2 studies shows both similarities and differences. This CPRD
based analysis identified higher prevalence proportions in females than males, whereas APMS
2023 to 2024 did not find differences by sex to be significant
This study found lower prevalence in younger adults (ages 14 to 24) and little variation between the other age groups, whereas APMS
2023 to 2024 found screened positive proportions were higher in younger age groups. Note that in the APMS
2023 to 2024 survey age is taken at time of survey, whereas the CPRD
based analysis looks for diagnosis or treatment in patient records up to the index date. These approaches are not the same.
Both studies suggested higher prevalence of the condition was associated with socioeconomic difficulties
The way the 2 studies considered ethnic groups were different, making comparison difficult, however the highest prevalence proportion in the White ethnic group seen in this CPRD
analysis was not obviously replicated in APMS
2023 to 2024
The CPRD
analysis showed evidence of higher prevalence in the north of England and notably lower prevalence in London. This variation was not observed in the APMS
2023 to 2024 survey
It should be recognised that although these 2 analyses have differences, both make a useful contribution to understanding variation in prevalence of bipolar disorder within the population in England
SMI
in primary care (Quality and Outcome Framework)
The number of people and the proportion of the population with SMI
in England are presented annually in NHS England’s Quality and Outcomes Framework (QOF
) 2023 to 2024. This is not the most recent QOF
, but it contains the correct data for comparison with modelled estimates for 2023.
QOF
is a list of patients with SMI
identified by GP practices in England, including patients with schizophrenia, bipolar disorder and other psychoses, as well as those on lithium therapy
The count of individuals with SMI
in primary care, based on diagnosis and treatment codes in QOF
is similar to, but not the same as, the CPRD
based analysis. QOF
is an incentivised but voluntarily maintained register for all of England, whereas the CPRD
figures are based on analysis of patient records from practices covering around 25% of England. Counts and prevalence proportions for QOF
are generally presented for all ages, whereas outputs from the CPRD
analysis are presented for the population aged 14 and over. Characteristics of the SMI
cases such as sex, age, ethnicity and deprivation are not presented in the QOF
register outputs, whereas this intelligence is available for the CPRD
analysis. Although people with schizophrenia, bipolar disorder and other psychosis make up the QOF
mental health register, these conditions are not presented separately, whereas within the CPRD
based analysis they are.
As the CPRD
analysis is based on data from 30 September 2023, this report considers data from QOF
2023 to 2024 (rather than the most recent year). For QOF
the England prevalence is 0.96% for all ages. When this is converted to the population aged 14 and over as used on this CPRD
analysis, this is 1.13%, which is slightly less than the CPRD
based modelled estimate (1.16%)
There is a greater variation based on QOF
than for the modelled estimates. The QOF
prevalence range at UTLA
level is 0.72% to 1.87%, whereas for the CPRD
analysis it is 0.82% to 1.58%. The same UTLA
has the highest SMI
prevalence for each method, although the QOF
prevalence is 0.29% higher. For some UTLAs
the modelled estimates are higher and for others QOF
rates are higher. Generally UTLAs
in the north and the Midlands have modelled estimates higher than QOF
rates. However, 6 of the 10 UTLAs
with the biggest difference, where the QOF
rate is higher, are in London, and 3 cover coastal urban areas.
SMI
prevalence present similar results with some notable differences. The definition and approach used to obtain both measures of prevalence are likely to contribute to the differences. When comparing the 2 sets of prevalence, it should be considered that:
- QOF
codes for mental health overlap considerably (but not exactly) with the SMI
code list used in this analysis and therefore practice or general practitioner coding behaviours may play a role – for example, some severe depression codes are included in QOF
only, possibly leading to higher prevalence for some areas - QOF
uses all age populations, whereas only ages 14 and over were used for the modelled estimates, which may result in lower QOF
prevalence proportions for areas with younger populations - QOF
uses population registered with GPs within an area, whereas the model-based estimates are produced using resident populations. Registered populations are usually larger (particularly in some urban areas) due to mobility of population, and there is greater risk of some individuals being counted in more than one general practice - some population groups with increased risk of SMI
are less likely to be known to their GPs and this might be more likely for some areas. These populations would not be captured in QOF
, but in the model estimates they are reflected in the same way across all areas
Both sets of prevalence estimates have value. QOF
prevalence proportions are based on data from all of England, whereas the CPRD
analysis is based on a large sample. The CPRD
analysis applies the same 200 modelled prevalence percentages to all geographies in England and also offers estimates for the condition groups that make up SMI
Guidance on how to use these findings
Local area estimates for SMI
(and condition groups) are provided at a range of geographies for service planners to use directly from the Adult mental health and wellbeing profile on Fingertips. It should be noted that these are modelled prevalence estimates, based on identified CPRD
cases, that are then modelled to the variation in sex, age, ethnicity and area deprivation of the local resident population.
This report also provides prevalence proportions for SMI
(and condition groups) by sex, age, aggregated ethnic group and deprivation taken directly from the CPRD
cohort. They are not modelled estimates, however, they do provide an indication of what variation by these factors looks like in local areas
The report provides prevalence estimates by SMI
condition group (schizophrenia, bipolar disorder and other psychosis). These estimates highlight that the condition makeup of SMI
can vary between areas. People with different conditions are likely to have different mental and physical health needs. This intelligence can help planning of the services, providing an indication of the type and level of service required to support people with these different conditions locally.
Generally, when modelled prevalence estimates such as these are presented, they come with CrIs
. This is because the estimate is unlikely to be exact and a range around the figure is useful to aid planning. There are no CrIs
with these modelled estimates, due to difficulties with calculating helpful CrIs
. Users of these local prevalence estimates should not view them as exact – instead they are a useful guide to the level of need in an area. Any service planning should consider that number of cases may be either lower or higher than the proportion and number of cases presented.
Methodology
This section describes the approach followed to produce the prevalence estimates of SMI
and the condition groups. An external expert reference group (ERG
) supported the development of these estimates. The ERG
included academics, clinicians, and mental health policy leads with an expertise in data, service and clinical areas relating to SMI
Data source
The CPRD
Aurum database was chosen as the most appropriate dataset to estimate prevalence of SMI
(and condition groups) across England. CPRD
Aurum is a non-random sample of primary care data containing anonymised patient records such as medical observations (diagnosis, symptoms and treatments), medication prescriptions and practice details. The dataset covers around 25% of the total registered practice population in England. CPRD
was selected for this study because it:
- has a large sample size
- is broadly representative of the population in England
- has good data quality in terms of recording and high levels of completeness[footnote 2]
Terminology and definitions
This report and the analysis within it use the National Institute for Health and Care Excellence (NICE
) guidance to define SMI
and the conditions groups. This includes NICE
guidance relating to:
- bipolar disorder: assessment and management (CG185)
- psychosis and schizophrenia in adults: prevention and management (CG178)
- coexisting severe mental illness (psychosis) and substance misuse: assessment and management in healthcare settings (CG120)
Severe mental illness
The term ‘severe mental illness’ (SMI
) refers to a group of conditions that are typically long-lasting and significantly impact an individual’s ability to carry out everyday activities and participate in work. SMI
usually includes diagnoses such as schizophrenia, bipolar disorder or other psychotic disorders, all of which result in severe impairment of functioning[footnote 3]
Bipolar disorder
As defined by NHS England in APMS
2023 to 2024, bipolar disorder is a mental health condition characterised by recurring episodes of depression, mania, hypomania and mixed episodes. NICE
’s CG185 guideline adds that individuals with bipolar disorder may also experience symptoms of psychosis, including hallucinations (such as seeing or hearing things that are not present) and delusions (holding beliefs that are not based in reality).
Psychosis and schizophrenia
As defined by NHS England in APMS
2023 to 2024 psychotic disorder chapter, schizophrenia is a mental health condition characterised by significant disruptions in perception, beliefs and thinking such as experiencing hallucinations or delusions. Psychotic disorder includes a range of conditions such as schizophrenia. NICE
’s CG178 guideline adds that psychotic symptoms typically begin during early adulthood, but they can develop at any age. The classification of psychosis often depends on the stage of the diagnostic process, with initial general terms being replaced by more specific diagnoses over time (for example, a diagnosis may progress to schizophrenia)[footnote 4]. In this study, where diagnostic codes do not permit assignment to the schizophrenia group, these cases are categorised as ‘other psychosis’.
Study design and population
A cross-sectional study design (which collates data at a specific point in time) was used to identify the study population as people aged 14 and over in CPRD
Aurum. People under the age of 14 are unlikely to be diagnosed with SMI
and therefore are not covered by this analysis. This study population was used to identify people with SMI
(cases) – see the ‘Case identification’ section
People were included in the analysis if their medical records were of sufficient quality for research and as of 30 September 2023 they were:
- alive and registered as a patient with a GP practice in England
- aged 14 years or older
- a registered permanent patient with an active GP practice submitting to CPRD
Aurum
Case identification
This study identified people with SMI
(cases) by reviewing all available medical history in CPRD
for each person in the study population. Cases were assigned based on evidence of a recorded diagnosis, treatment received or symptoms recorded in primary care records. To identify these cases, a list of SNOMED CT and READ codes was used. This list was checked and approved by academic and clinical experts.
On the index date, 30 September 2023, a total of 12,467,991 individuals aged 14 and over were identified in the CPRD
. Of these, 147,374 people had evidence of SMI
recorded in their medical history. The identification and assessment of SMI
cases for allocation to a single condition group followed the steps outlined below:
- Diagnosis codes group – using disorder codes (including ‘history of’ codes), 140,928 SMI
cases (95.7% of all cases) were identified. Cases were allocated to schizophrenia first, followed by bipolar disorder and finally to other psychosis reflecting diagnostic hierarchy[footnote 5]. - Lithium therapy codes group – using administrative lithium therapy codes recorded 6 months before the index date, 3,271 SMI
cases (2.2% of all cases) were identified. Cases were allocated to bipolar disorder only. Other medications were not considered as some are also used for conditions other than SMI
. For example, research shows that a large proportion of people prescribed antipsychotics are often older people with conditions including dementia, non-psychotic depression, anxiety and sleep disorders[footnote 6]. - Non‑pharmacological treatment codes group – using non‑pharmacological treatment codes recorded 6 months before the index date, this step identifies cases for bipolar disorder and psychosis. For current analysis period (30 September 2023), no cases were identified from this step.
- Symptom codes group – using symptom codes recorded 12 months before the index date, 3,105 SMI
cases (2.1% of all cases) were identified. All cases were allocated to other psychoses – people with a dementia diagnosis in the previous 2 years were excluded. All bipolar disorder cases were identified in steps 1 to 3. No symptom codes for schizophrenia were identified in the CPRD
code dictionaries.
Out of the 147,374 SMI
cases identified, the above approach resulted in:
- 52,598 schizophrenia cases (35.7% of all SMI
) - 48,157 bipolar disorder cases (32.7% of all SMI
) - 46,549 other psychosis cases (31.6% of all SMI
)
Prevalence
This study uses lifetime prevalence approach. This is defined as the percentage of people aged 14 and over within the study population who have recorded evidence of SMI
any time in their medical records history on any date up to and including the index date. This study measures contact prevalence of SMI
, based on individuals who have sought healthcare from their GPs for their condition or their GP has a record of their condition.
Modelled prevalence estimates
This analysis uses indirect (synthetic) estimation approach to model prevalence of SMI
for England, and for each UTLA
, ICB
, NHS region and statistical region. In other words, SMI
prevalence proportions for each geography presented in this report are not observed but estimated. This approach is used because:
- CPRD
is a non-random sample of around 25% of registered population in England - not all regions are equally represented in CPRD
- geographical breakdown of data below regions is not possible within CPRD
Model-based SMI
estimates were produced by applying the prevalence proportions derived from CPRD
to resident populations in England, and for each UTLA
, ICB
, NHS region and statistical region. Therefore, the prevalence estimates are based on:
- numerator – the estimated number of people aged 14 and over who are expected to have SMI
in England, and for each UTLA
, ICB
, NHS region and statistical region by applying the probabilities of having SMI
by deprivation, sex, age and ethnicity derived from CPRD
(using multivariable logistic regression model – see Logistic regression section) to resident population estimates for each area using the same groups - denominator – total resident populations aged 14 and over in each area
The final estimates are presented as a proportion of people 14 and over in an area expected to have SMI
Resident populations
Census 2021 resident populations at lower super output area (LSOA) by sex, age and ethnicity were linked to the IMD
2019, which is the most widely used index of deprivation for England. It is the official measure of relative deprivation for small areas, containing 7 domains (including income, employment, education, health, crime, housing and living environment) to produce an overall relative measure of deprivation. For all geographies populations were produced for each deprivation quintile by sex, age groups and ethnicity. These sub-groups populations were used to model the estimates of SMI
.
The final populations used to calculate the prevalence estimates were derived by summing the sub-groups across the stated geography
Further information on how the denominator populations were calculated is available in the definitions section of the indicator in the adult mental health and wellbeing profile
Logistic regression
A multivariable logistic regression model was used to estimate the probability (likelihood) that a person aged 14 or over, identified in the CPRD
on 30 September 2023, has SMI
as the health outcome (dependent) variable. The model included predictor (independent) variables measured at:
- individual (compositional) level and including:
- sex as males and females
- age groups as 14 to 24, 25 to 34, 35 to 64, and 65 and over
- ethnicity groups as Asian, Black, Mixed, Other and White
- area (contextual) level using deprivation quintiles based on IMD
2019
Although the evidence remains inconclusive, research shows that sex, age, ethnicity and area deprivation are all statistically significant factors associated with a diagnosis of SMI
[footnote 7]. In the logistic regression model, each of these variables was found to be significantly associated with SMI
. Probabilities of having SMI
were produced for all 200 distinct groups – for example, males aged 14 to 25 from Asian ethnic group and most deprived quintile formed one group. Area deprivation quintiles rather than deciles were used to ensure sufficient sample size for each group. This process was repeated for each condition group. These probabilities were used to estimate prevalence for all geographies.
To evaluate how well the regression model predicts SMI
and each condition group, receiver operating characteristic, area under the curve (ROC AUC
) was used. ROC AUC
helps to assess the model’s ability to distinguish between SMI
and non SMI
cases. For SMI
overall and the condition groups, ROC AUC
values in this analysis ranged from weak to acceptable (0.63 to 0.73) – values can range from 0 to 1 with 0.5 indicating random and 0.9 or higher excellent prediction. This means that the model correctly predicts between 63% to 73% of cases.
As SMI
has a low prevalence this may impact on the ROC AUC
value and its use [footnote 8]. Risk factors for SMI
are wide ranging (including social, environmental, biological, clinical and behavioural factors) and therefore statistical modelling of SMI
prevalence is complex impacting on the best achievable value for ROC AUC
. Furthermore, research shows that where mental health outcomes are associated with socioeconomic status (such as deprivation), the variation at aggregate area level may arise from the variation in the characteristics of individuals living in these areas [footnote 9]. This has not been accounted for in the current model.
Credible intervals
Usually, an indirect approach to modelled prevalence (as used in this work) would include credible intervals (CrIs
) around the estimated prevalence proportions. This provides a level of probability the estimate (in this case modelled prevalence proportion) is expected to lie within, given the evidence provided by the observed data (in this case CPRD
). Because of the large study population used from CPRD
and it being a non-random sample, the CrIs
would be narrow. This would not accurately represent the performance of the logistic regression model and the subsequent approach used to model the prevalence as it would not take account of the size of the local population and would give a misleading confidence around the modelled estimates. As a result, CrIs
are not provided for these modelled estimates.
Future updates of the prevalence estimates
These modelled estimates will be updated after an appropriate period of time
Analysis within CPRD
data is based on cases identified up to 30 September 2023. Although not the same time period, Census 2021 offered the opportunity to source local population counts, including ethnicity. Future updates will depend on the availability of post‑census local ethnicity estimates. Exploration of ONS
work in this area, and the possible renewal of EthPop (modelled estimates and projections by ethnic group for local areas in the UK) should be considered.
To improve future estimates the following will also be considered:
- increasing SMI
coverage by including as much primary care data as possible - developing the statistical modelling by adding non-demographic variables – for example, clinical, service use or behavioural variables
- using other measures to assess how well the logistic regression model predicts SMI
as a rare condition - developing the statistical modelling to use multilevel techniques to account for the impact of clustered or grouped data and how those groups interact with individual level factors to assess how much variation in SMI
is due to differences between individuals’ sex, age or ethnicity (compositional factors) and how much is due to differences between the geographical areas the individuals are resident in (contextual factors) - developing an approach to produce confidence interval or credible ranges for inclusion with the prevalence estimates
Limitations of the study
When using the modelled SMI
prevalence estimates consider limitations such as:
- estimates include SMI
recorded by healthcare professionals in primary care records. They exclude undiagnosed cases and diagnoses from other settings not yet entered into these records, which can be subject to considerable delay - bipolar disorder as recorded in primary care might be an underestimate due to diagnostic delays. Some research suggests delays of 5 to 10 years from the onset of symptoms before the final diagnosis is confirmed [footnote 1], which might be due to:
- the clinical criteria available as defined in the Diagnostic and Statistical Manual of Mental Disorders and summarised by NICE
in clinical knowledge summaries: bipolar disorder - healthcare challenges, mental health stigma, the complex nature of bipolar disorder and individual factors [footnote 10]
- prevalence is based on recording of conditions, treatment or contact for people with SMI
within primary care settings and hence is not a true population prevalence - primary care recording of SMI
varies between practices and over time - the period of medical history differs between patients. Individuals with a shorter period might be less likely to have their SMI
recorded in primary care - where SMI
is identified using diagnosis codes for a disorder there is no time restrictions for case ascertainment to account for recovery - CPRD
data includes only individuals who are registered with a GP practice, meaning that certain groups who are at increased risk of mental health problems, such as people experiencing homelessness and some migrant populations, may not be adequately represented - CPRD
Aurum is a non-random sample covering around 25% of registered population in England. As not all regions are equally represented some populations at higher or lower risk of SMI
might be under or over represented - patients with sex recorded as female or male only are included – other gender made up 0.01% of records
- patients with missing ethnicity (3.68%) are excluded from the analysis
- where residence‑based deprivation quintiles were unavailable, the GP practice postcode was used to assign deprivation
- the cross-sectional study design used to calculate lifetime prevalence means that:
- due to high early mortality in people with SMI
the prevalence might be an underestimate. This might particularly be the case for older people - the impact of population immigration and emigration on the prevalence was not accounted for
- due to high early mortality in people with SMI
- multilevel modelling was not carried out to assess to what level the variation in SMI
at area level is due to the variation in the sex, age and ethnicity of individuals living in these areas - the estimates are modelled using sex, age, ethnicity and deprivation. Other local factors not captured in the model might be important predictors of SMI
diagnosis - populations for ages 14 to 24 were derived using the age 14 from the 9 to 14 age group, the 15 to 19 and 20 to 24 age groups
- data extracted from CPRD
uses 2023 data, whereas the populations used to model the prevalence are based on 2021 Census - presentation of prevalence estimates for UTLAs
and ICBs
in this report uses quintiles based on simple ranking, which may mean that areas with similar prevalence might be included in different quintiles
Acknowledgements
This work is the result of collaboration between OHID
and NHS England
It has been guided and supported throughout by an expert reference group made up of clinicians, academics, analysts and policy leads, many of whom work outside of DHSC
or NHS England. Without their knowledge, collaboration and commitment this work would not have been possible
The responsible statistician was the Head of Intelligence (Mental Health Intelligence Team, OHID
)
The product leads were the Programme Lead (Mental Health Intelligence Team, OHID
) and the Deputy Director (Clinical Epidemiology, OHID
)
If you have any questions relating to this publication, contact mhit@dhsc.gov.uk
Boseok C, Jeong HK, Tae HH, and others. Polarity of the First Episode and Time to Diagnosis of Bipolar I Disorder. Psychiatry Investigation 6(2), (2009). ↩ ↩2
Wolf A, Dedman D, Campbell J, and others. Data re Aurum. International Journal of Epidemiology, Volume 48, Issue 6, (2019). ↩
Smart EL, Brown L, Palmier-Claus J, and others. A systematic review of the effects of psychosocial interventions on social functioning for middle-aged and older-aged adults with severe mental illness. International Journal of Geriatric Psychiatry. Volume 35, Issue 5, (2020). ↩
Hobbs M, Stanbrook R, and Chakraborty N,. Frequency of change of diagnoses in first-episode psychosis. Progress in Neurology and Psychiatry, Volume 21, Issue 1, (2017). ↩
Launders N, Richards-Belle A, Hardoon S, and others. Severe mental illness (SMI
). Phenotype Library, [Online], 2024. ↩Marston L, Nazareth I, Petersen I, and others. Prescribing of antipsychotics in UK primary care: a cohort study. BMJ Open, Volume 4, Issue 12, (2014). ↩
Cruz J, Li G, Aragon MJ and others. Association of environmental and socioeconomic indicators with serious mental illness diagnoses identified from general practitioner practice data in England: A spatial Bayesian modelling study. PLoS Med, 19(6), (2022). ↩
Blake M, Tellen BD, DeWitt PE, and others. Use of the Area Under the Precision-Recall Curve to Evaluate Prediction Models of Rare Critical Illness Events. Pediatric Critical Care Medicine, 26(6), (2025). ↩
Fone DL, and Dunstan F. Mental health, places and people: A multilevel analysis of economic inactivity and social deprivation. Health & Place, Volume 12, Issue 3. ↩
Mehra N, Bhatia A, Ayis S, Maria, and others. Reasons for diagnostic delays in Bipolar Disorder: Systematic review and narrative synthesis. Qeios, Advance online publication, (2024). ↩
Back to top
